Network stats
The Network view in the admin panel is a live breakdown of what the relay is actually sending. It is the fastest way to answer "how much does my mod cost on the wire", so it is worth knowing how to read before you ship a component that replicates every tick.
Viewing it requires the Dashboard access permission.
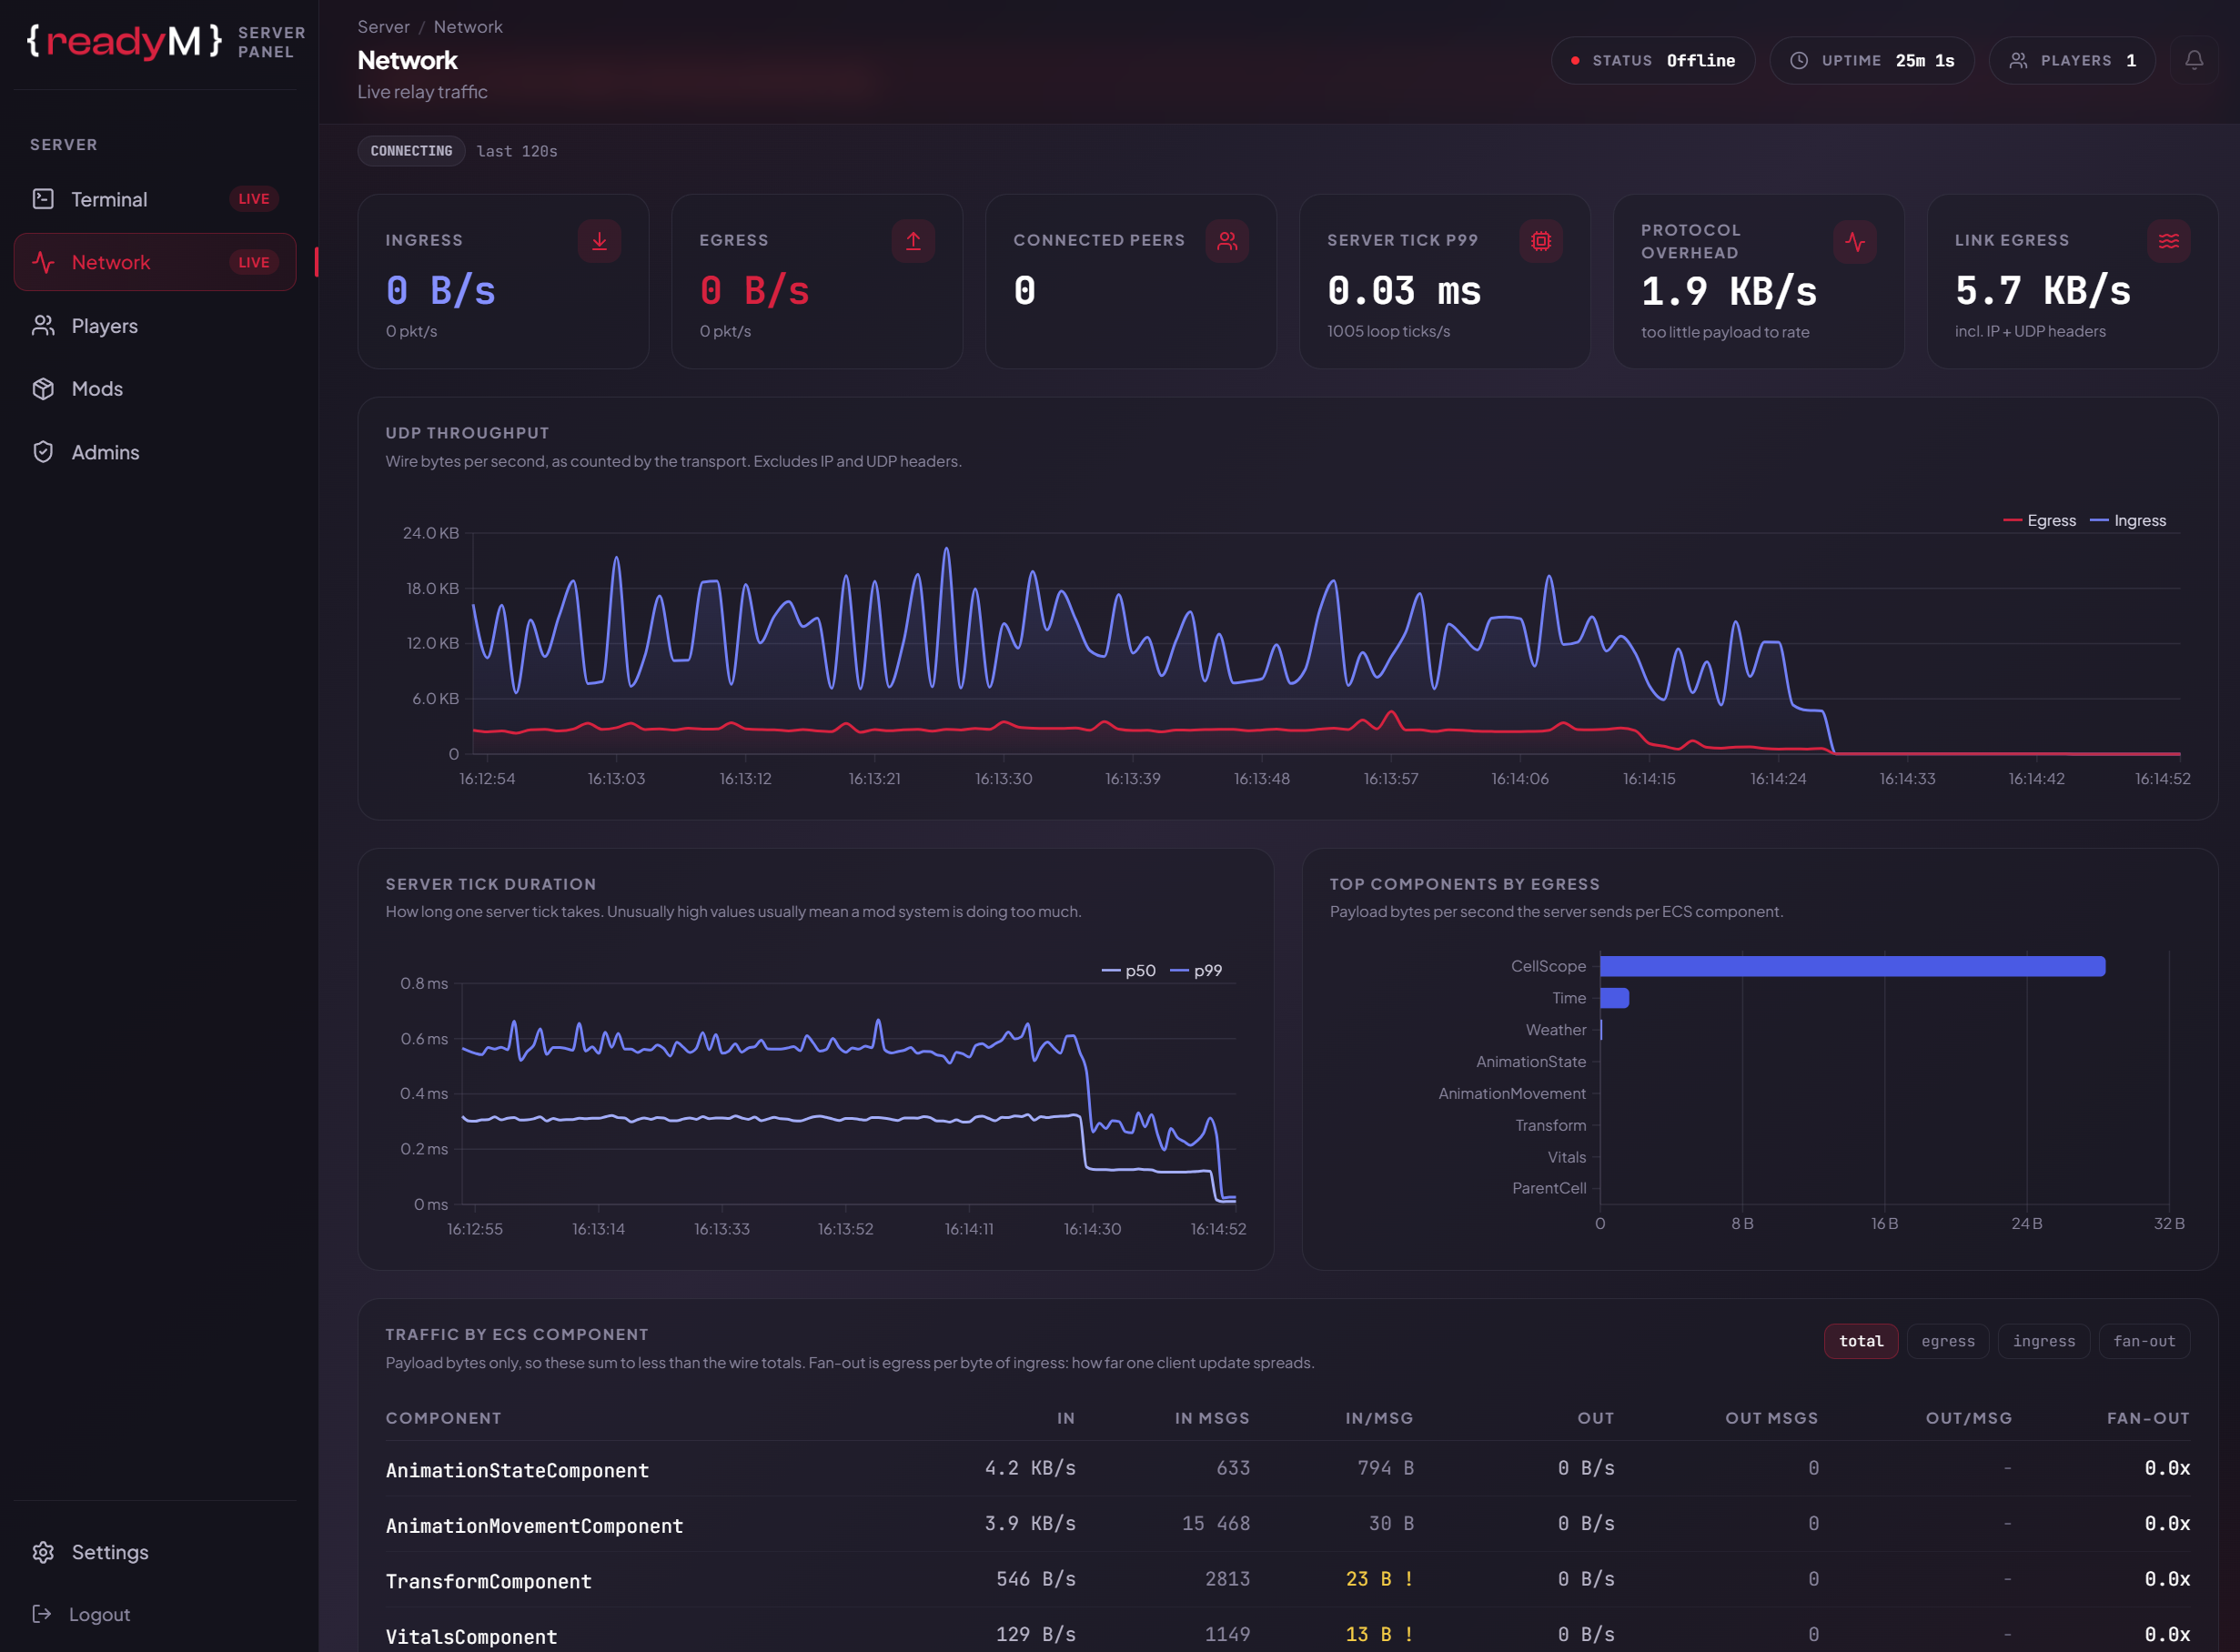
How sampling works
The server closes one measurement window per second and pushes it to the panel over an event stream. It retains the last 300 windows; the charts and tables show the most recent 120, which is what the last 120s label next to the LIVE badge means.
Windows do not overlap and nothing is smoothed across them. Every counter is snapshotted and zeroed at the window boundary. A burst of traffic therefore stays in the aggregate until it falls off the back of the 120 window view, then drops out on its own. That is normal, not a stat resetting.
The stream is only reported as broken after five seconds pass with no sample. A dropped connection retries by itself and the server replays its retained history on reconnect, so short interruptions leave no gap in the charts.
Wire bytes and payload bytes
Almost every confusion about this page comes from mixing up the two accounting layers, which are deliberately kept separate and will never agree.
Wire is ground truth from LiteNetLib: every byte it actually put on the socket, including channel headers, acks, pings and reliable retransmits. This feeds the Ingress, Egress and UDP throughput figures.
Payload is application bytes only, counted where the server composes and parses packets. This is what the per component and per message type tables show, and it is the only layer that can attribute bytes to your mod.
Payload always sums to less than wire. The difference is the Protocol overhead tile, and it is a useful signal in itself: a large gap means acks and retransmits, not your data.
Neither layer counts the 28 bytes of IP and UDP headers that every datagram carries. Link egress adds those back, and it is the only figure that reflects what your host actually bills you for.
Egress is counted per recipient. One delta composed once and relayed to five peers is five times the egress, because that is what leaves the box. This is why fan-out matters more than payload size for anything replicated to a busy area.
Summary tiles
| Tile | What it shows |
|---|---|
| Ingress | Wire bytes per second received, with packets per second underneath. Latest window only. |
| Egress | Wire bytes per second sent, with packets per second underneath. Latest window only. |
| Connected peers | Peers LiteNetLib currently holds a connection to. |
| Server tick p99 | 99th percentile tick duration in the latest window, with the achieved network loop rate underneath. |
| Protocol overhead | Wire egress minus payload egress, as a rate. Shows a percentage of egress only once payload passes 16 KB over the window, otherwise it says so instead of printing a confident number off a near zero denominator. |
| Link egress | Wire egress plus 28 bytes per datagram. Many small packets are cheap in payload and expensive here. |
UDP throughput
Wire bytes per second in and out, one point per window. Excludes IP and UDP headers, so compare it against Link egress rather than against your host's bandwidth graph.
Server tick duration
p50 and p99 of how long one server tick takes, measured around the whole system root update. Systems your mod registers run inside this, so this chart is where a system that does too much per tick shows up first.
Durations are histogrammed in 1 microsecond buckets, so the percentiles are exact rather than interpolated. Anything slower than 20 ms clamps into the top bucket; if you see a flat line at 20 ms, the real value is worse.
A rising p99 with a flat p50 is the usual shape of a system that occasionally does heavy work, for example one that scans every entity on a timer instead of reacting to a change.
Top components by egress
The eight components with the highest payload egress rate. Everything below that folds into a single Other (n) row rather than being dropped, so the bars always account for the full total.
The axis labels drop a trailing Component suffix to save width, so AnimationStateComponent charts as AnimationState. The table below keeps the full name.
Traffic by ECS component
Per component payload, aggregated across the visible windows.
| Column | Meaning |
|---|---|
| Component | Type name of the component. |
| In / Out | Payload bytes per second, averaged over the whole visible window. |
| In msgs / Out msgs | Message counts. These are totals over the window, not rates, unlike the byte columns beside them. |
| In/msg / Out/msg | Average payload bytes per message. |
| Fan-out | Egress divided by ingress, over the aggregate. How far one client update spreads. |
Every row is divided by the same total window duration, so a one shot 6 KB join payload reports a small per second figure rather than looking like sustained load. Rows are comparable against each other by design.
A yellow ! on a per message column means the average payload is smaller than the 28 bytes of framing each datagram costs, so most of the link cost is headers rather than data. Batching more state per packet is the fix, not shrinking the payload further.
Fan-out shows - when the component saw no ingress at all in the window. That is undefined, not zero, and it is the expected reading for server authored components that clients never send.
The sort tabs (total, egress, ingress, fan-out) only reorder the rows. Components with undefined fan-out sort last rather than as zero.
Traffic by message type
The same payload bytes, grouped by wire message code instead of by component. Use it to separate ECS state replication from RPC and from one shot events.
Built in codes appear under their protocol names: EcsDelta, EcsSnapshot, EcsCreateEntity, EcsDeleteEntity, EcsChangeOwnership, AreaEvent, HandshakeConnected and so on. Custom RPC codes have no name to look up and appear as ServerRpc(n) and ClientRpc(n), numbered by their wire code.
If EcsSnapshot is a large share of egress, players are crossing scope boundaries often. Snapshots are sent reliably and in full, so they are much more expensive than the deltas that follow.